Why monitor connectivity?
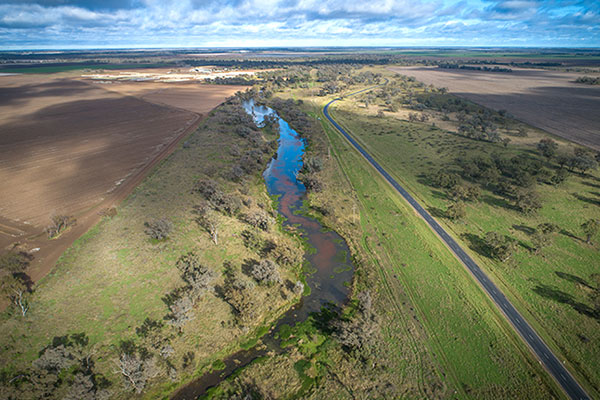
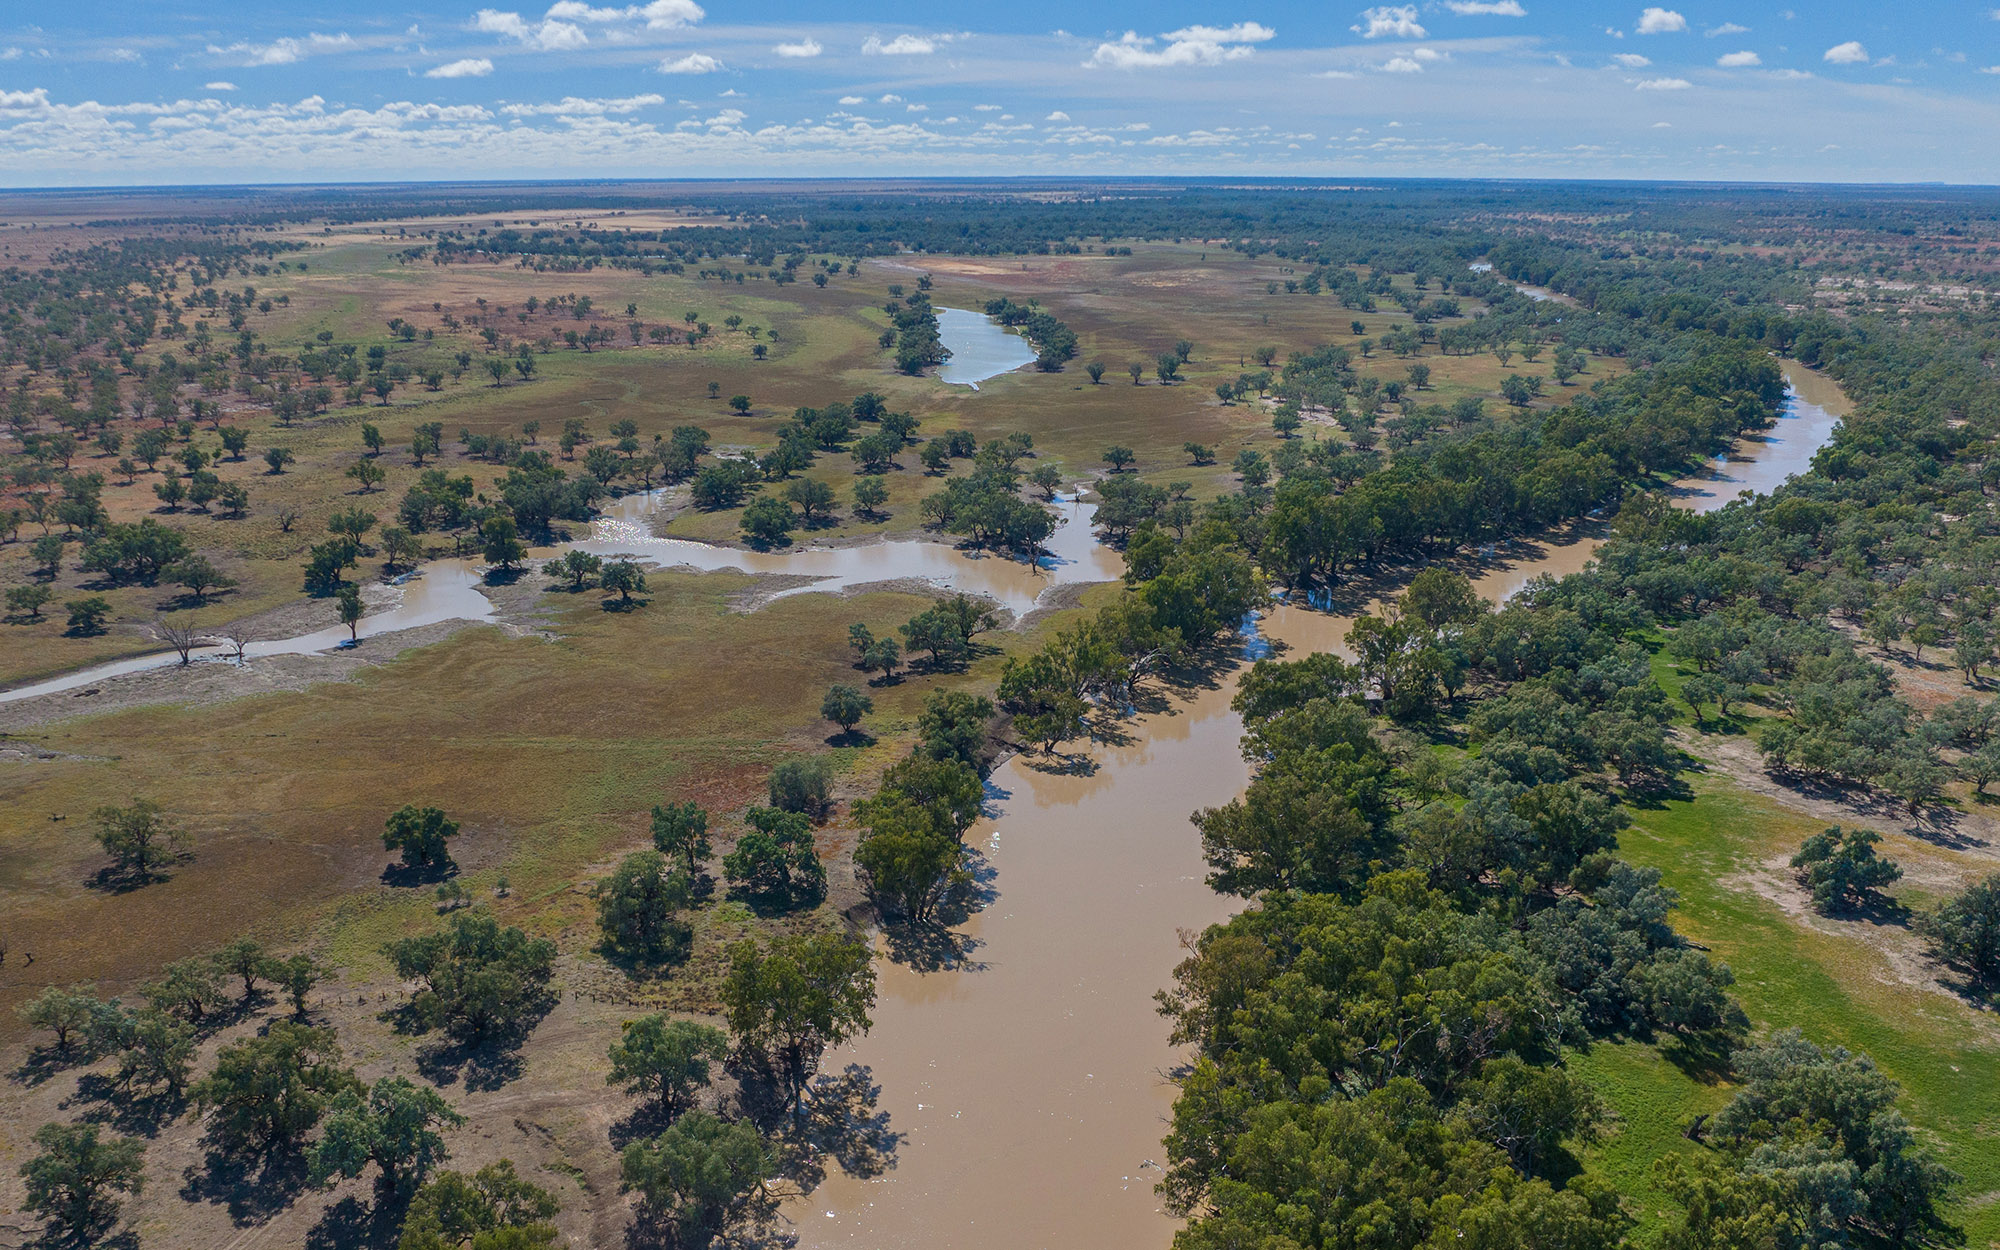
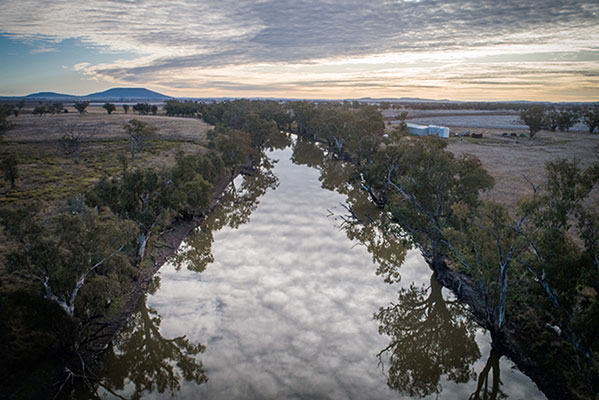
The connection between a river and the floodplains alongside it, is known as floodplain connectivity. This connection occurs when the water in a river rises over the bank and spills onto the surrounding landscape. These areas can also be inundated from excess rainfall runoff within the catchment.
The inundation of these areas is important to support healthy ecosystems. Connecting flows move nutrients and sediments and enable native fish and other organisms to disperse between habitats. The frequency, timing and duration of inundation events all impact the overall health of floodplain ecosystems.
We are using satellite imagery to map floodplain inundation in the Northern Murray Darling Basin, and where satellite imagery is not available due to issues such as cloud cover, we will use predictive modelling techniques. This work will help us to identify the effect of floodplain structures on flood pathways, validate environmental water requirements and link ecosystem health with inundation patterns.
Our projects include:
- Mapping and modelling floodplain inundation
- Validating overbank environmental water requirements
- Identification and mapping of flood paths and floodplain connectivity
- Assessing the impact of floodplain structures on flood paths
2021-22 floodplain connectivity and inundation annual report
The 2021-22 floodplain connectivity and inundation annual report introduces the flood inundation mapping project that commenced during the first year of the Environmental Outcomes Monitoring and Research Program.
Download the report (PDF. 2,400KB)In 2021-22, the flood inundation mapping project has:
- Assessed the suitability of a number of datasets, water indices and thresholds for mapping inundation extent across the northern Murray-Darling basin.
- Produced over 400 maps of inundation extent for each catchment in the northern Murray-Darling basin. These maps closely represent the extent of field-observed inundation.
- Undertaken a case study within the Border Rivers catchment.