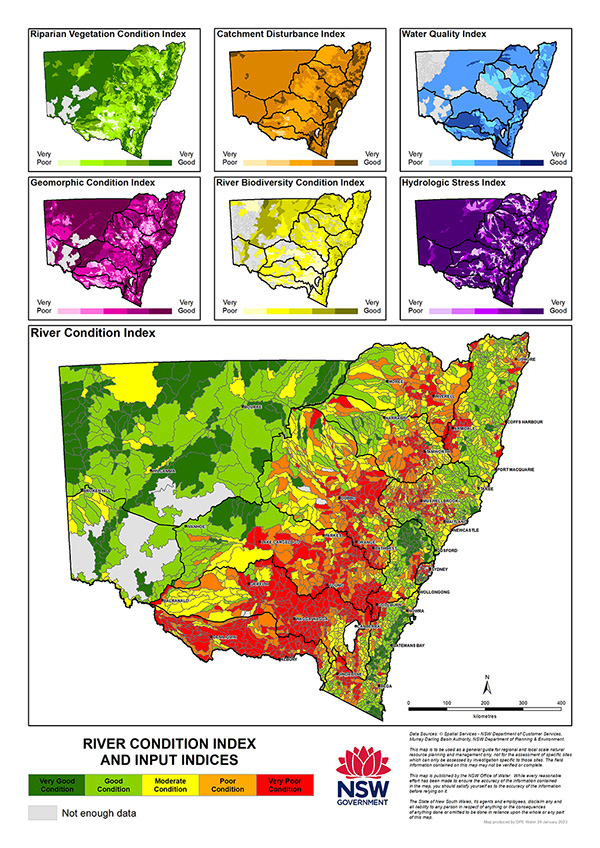
The NSW River Condition Index (RCI) is a long-term reporting tool for assessing river condition. The tool uses inputs from a range of indicators to cover all aspects of river health. The indicators include water quality, river form, surrounding vegetation and the animals that live in rivers.
The NSW RCI was developed and first published in 2012, using the Framework for the Assessment of River and Wetland Health (FARWH). The FARWH approach recognises the effects of catchment disturbance, physical form of the landscape, long term flow patterns, water quality, riparian vegetation extent and condition, and aquatic life as measures of river health. The FARWH method uses existing data collection activities and converts them into a standardised score of river health that is nationally comparable.
The NSW RCI (2023) is available via the SEED open data portal and as an interactive map. The method for calculation of the RCI components (PDF, 3.0MB) is also available.
Inputs into the NSW River Condition Index
The RCI includes riparian vegetation condition, geomorphic condition, hydrologic stress, biodiversity condition, catchment disturbance and water quality. Each is explained below.
Riparian vegetation condition
A riparian zone or riparian area is the interface between land and a river or stream. Riparian vegetation are the plants occupying this zone. Riparian vegetation is more diverse and abundant than nearby terrestrial habitats. Healthy riparian zones provide many benefits, including:
- habitat for native birds, reptiles, frogs, mammals and insects
- shade to help moderate water temperature
- organic input to waterways
- bank stability
- a filter for runoff that trap land-based sediment and nutrients.
The River Condition Index assesses riparian vegetation condition using:
- riparian zone width
- the extent of native woody vegetation
- the extent of native non-woody vegetation
- landscape connectivity (fragmentation and patch size).

Figure 1. Good versus poor riparian vegetation condition.
Geomorphic condition
Rivers are diverse in their physical character and behaviour. Human-induced changes in a catchment affect river processes.
Geomorphic condition measures natural channel function against its response to change. Rivers in good geomorphic condition are important for instream biodiversity, ecological diversity, and overall catchment condition. There is a strong connection between healthy floodplain, channel and groundwater. Rivers in poor geomorphic condition are indicative of stressed catchments. These rivers are unlikely to favour aquatic biodiversity. This is due to a reduction in geomorphic stability and available habitat. The connection between floodplain and groundwater is lost as the channel incises into its bed.
The River Condition Index uses the River Styles Framework to assess geomorphic condition. The River Styles approach scores river reaches according to their river type, behaviour, condition, fragility and recovery potential, relative to a reference condition.

Figure 2. Good versus poor geomorphic condition
Hydrologic stress
Hydrologic stress is a measure of change to natural flow regimes in catchments. It is the amount of water extracted relative to river flow. Hydrologic stress shows the risks posed to instream values from extraction. It is an indicator of the degree of competition between extractors. Hydrologic stress helps to assess river condition.

Figure 3. Hydrologic stress in low flow conditions and water extraction in low flow conditions.

Figure 4. Hydrologic stress in no flow conditions and water extraction in no flow conditions.
River biodiversity condition
Aquatic biodiversity is the variety of plants and animals that live in aquatic habitats such as rivers and streams. Aquatic species include fish, macroinvertebrates, frogs, reptiles, aquatic and riparian vegetation. Aquatic species rely on healthy rivers and diverse habitats for survival and reproduction. These biotic indicators can help assess river condition. Reduced river condition is associated with loss of species.
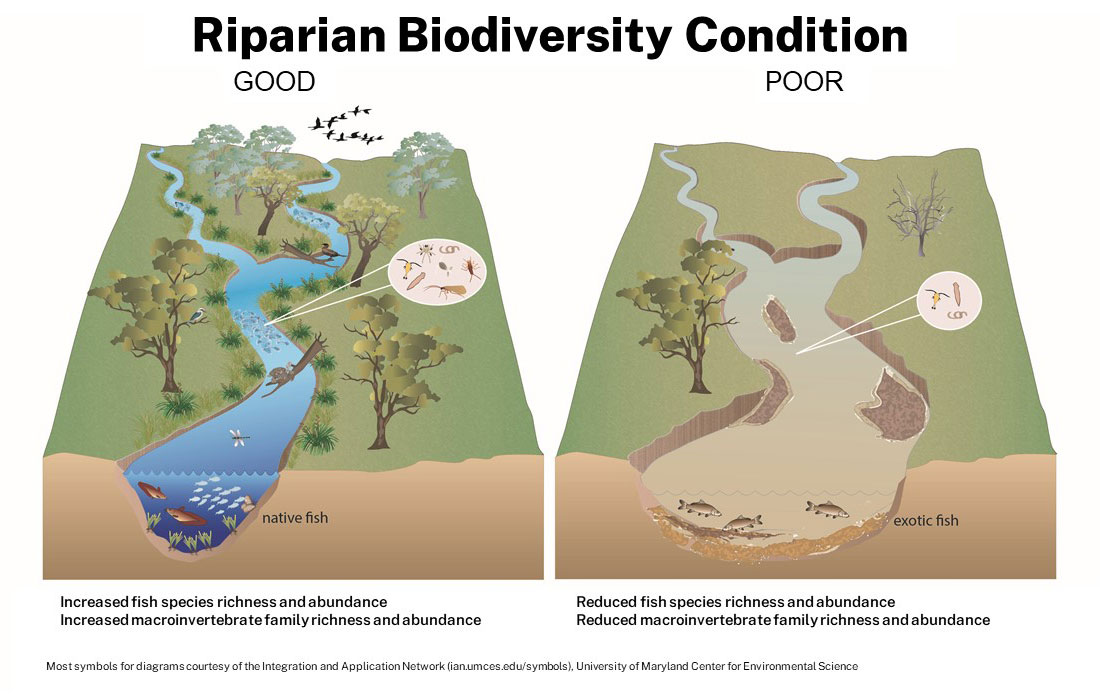
Figure 5. Good versus poor river biodiversity condition.
Catchment disturbance
Many activities in a catchment affect river health and resilience. These include land-use, habitat modification, infrastructure, and land management practices.
The Catchment Disturbance Index is a catchment summary of the type and extent of change in a catchment. It helps to assess river condition and includes the following features:
- infrastructure
- land-use
- land cover change.
Infrastructure measures the extent of roads, unsealed roads, railways, utilities (e.g. power, pipes) and walking tracks. Land-use measures the extent of horticulture, orchards, cropping, cotton, rice, transport, production forests, grazing and wilderness/National park areas. Land cover change measures the loss of woody vegetation using satellite imagery.

Figure 6. Good versus poor catchment disturbance.
Water quality
Water quality is a key driver of aquatic ecosystem condition. Both natural characteristics and human activities can influence water quality and thus ecosystem condition. For example, local geology can influence salt and nutrient inputs while climate, riparian vegetation extent and health, and stream flow influence sediment and nutrient loads. There are a wide range of human activities that can impact water quality. These include water extraction, pollution and changed land use.
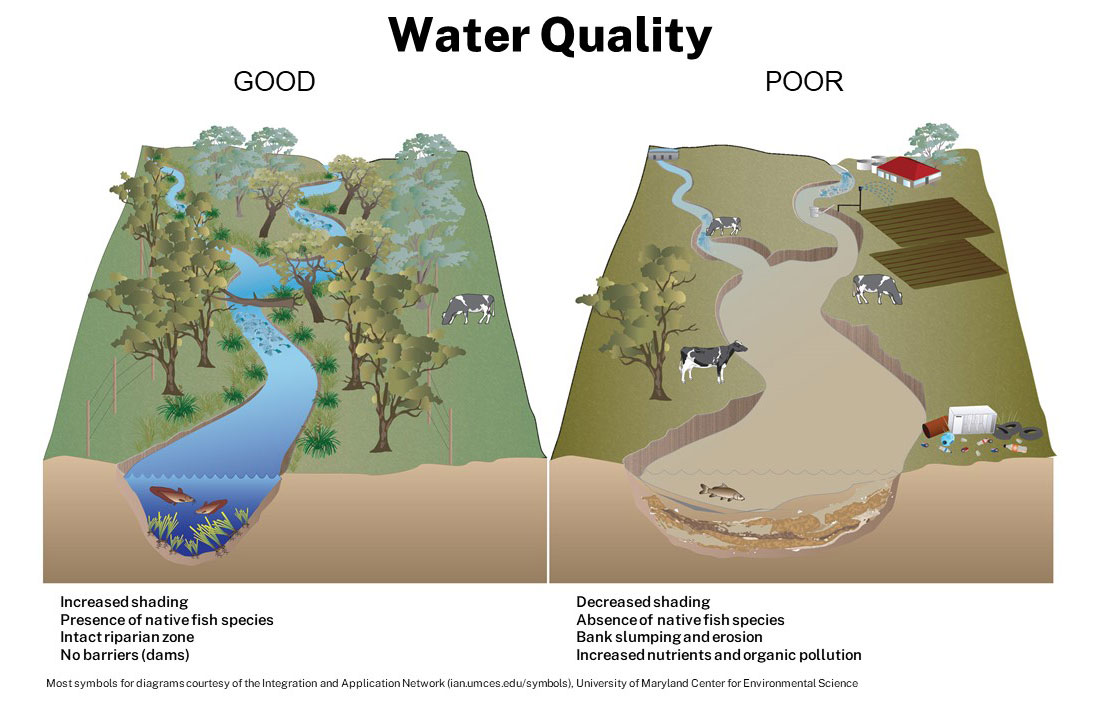
Figure 7: Good versus poor water quality.